01 · Asset management
What inventory do you own?
Panel IDs, locations, formats, leases and maintenance records describe the asset.
For media owners
See what is obstructed now, what is forecast to cross the action threshold this year, and where to act first.
Start with panel locations. No booking systems or revenue data required.
Network control
Eastern portfolio · 2,000 panels
Network horizon
1,572
Clear
304
Monitor
124
Action
124 panels are forecast to be obstructed or beyond the action threshold in the annual view, 51 more than today.
Priority worklist · 12 months
Forecast sightline
May 2027 · Illustrative model
Obstruction
74%
Action horizon
Overdue
Recommended next action
Reverify after works
Dated evidence
Every result carries its survey date.
Annual network forecast
Count affected panels now and across the next 12 months.
No system integration
Start with panel locations.
Reviewed outputs
Published results are checked by a person.
01 · Asset management
What inventory do you own?
Panel IDs, locations, formats, leases and maintenance records describe the asset.
02 · Campaign delivery
What advertisement ran?
Scheduling and proof-of-play systems record what was displayed and when.
03 · Physical visibility
Is the sightline still clear?
Kestryl measures physical obstruction around each panel and maintains a dated visibility record.
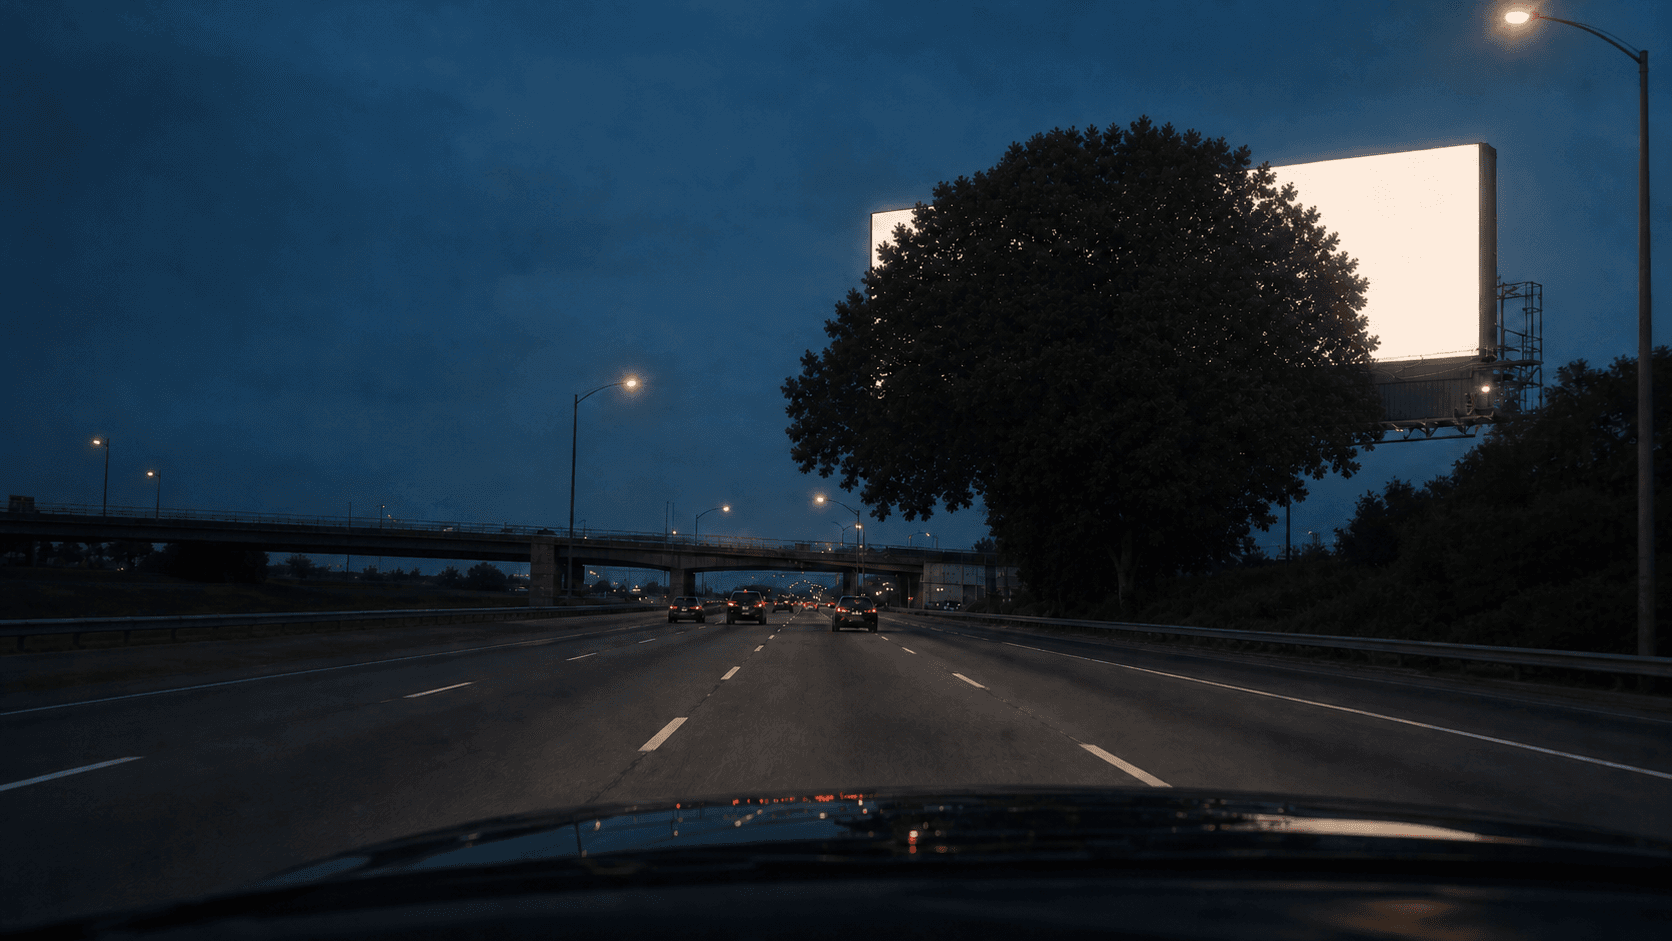
The panel may not have changed. The physical environment around it has.
Trees grow gradually. Canopies spread unevenly. Kestryl turns that quiet, distributed risk into one current network view.
Switch horizons to see the affected-panel count change.
May 2026
8% obstruction
Nov 2026
17% obstruction
May 2027
31% forecast obstruction

Illustrative forecast
The view changes continuously. The dated reading moves in fixed evidence steps.
Every measured result carries a survey date. Forecasts are shown separately and tied to their evidence and confidence.
Review the methodology →Annual network planning
Plan the year before the canopy does.
Forecast pulse
May 2026 measured · June 2026–May 2027 forecast
Forecasts model vegetation growth, seasonal leaf cycles and site characteristics. Measured values remain distinct from forecast values.
Affected panels are ranked by visibility risk, expected change and evidence quality.
Every flagged asset resolves into an owner-side action.
GS-1147 · Hoddle Street
61% obstruction · Risk increasing · Council permit pathway identified
ML-0821 · Nepean Highway
43% obstruction · Stable · Owner-side vegetation
CBD-3044 · City Road
18% obstruction · Forecast crossing expected in 9 months
Each priority site can include
Not a one-off audit
A panel's physical environment continues to change after the day it is inspected. Kestryl combines recurring surveys with dated forecasts to identify where visibility risk may increase before the next network review.
Measured observations remain distinct from forecasts, so teams can see what is known, what is expected and how confident the evidence is.
Detect. Prioritise. Act. Reverify.
Detect
Identify where vegetation is affecting panel visibility.
Prioritise
Rank sites by severity, expected change and commercial importance.
Act
Prepare evidence and permit pathways for agreed priority sites.
Reverify
Record the result after works and maintain the panel's visibility history.
Kestryl does not replace asset management. It adds the physical visibility record that asset systems do not currently hold.
Network rate
$100
per panel, per survey
Minimum 500 panels
Panels are typically surveyed twice yearly.
Final scope depends on panel coverage, available geometry and survey requirements.
Every Network Program includes
Kestryl Verified
Kestryl is building towards a current verification status for every assessed panel. A current visibility record can help sales teams demonstrate that inventory has been reviewed, while keeping internal maintenance and operational information private.
Network visibility
Send your portfolio. Kestryl will assess coverage and identify the best starting point for a network visibility program.
Selected founding partners can request a small visibility sample.
Figures are drawn from Kestryl's survey findings, full media-owner network audits and aggregated industry data. Methodology