
- Sample
- 2,000+ mapped or screened · 48 deep-scored
- Source
- High-resolution aerial imagery
- Cadence
- 2 surveys / year
- Review
- Every published result human-reviewed
Evidence stack
Four forensic layers. One verifiable sightline. Measured, not guessed.

Layer 01
Aerial imagery
Every market is assessed from high-resolution aerial imagery on a repeating capture cycle. A single capture yields aligned surface, ground and vegetation layers, so canopy extent and canopy height are always read from the same moment in the same capture.
Layer 02
Geospatial modelling
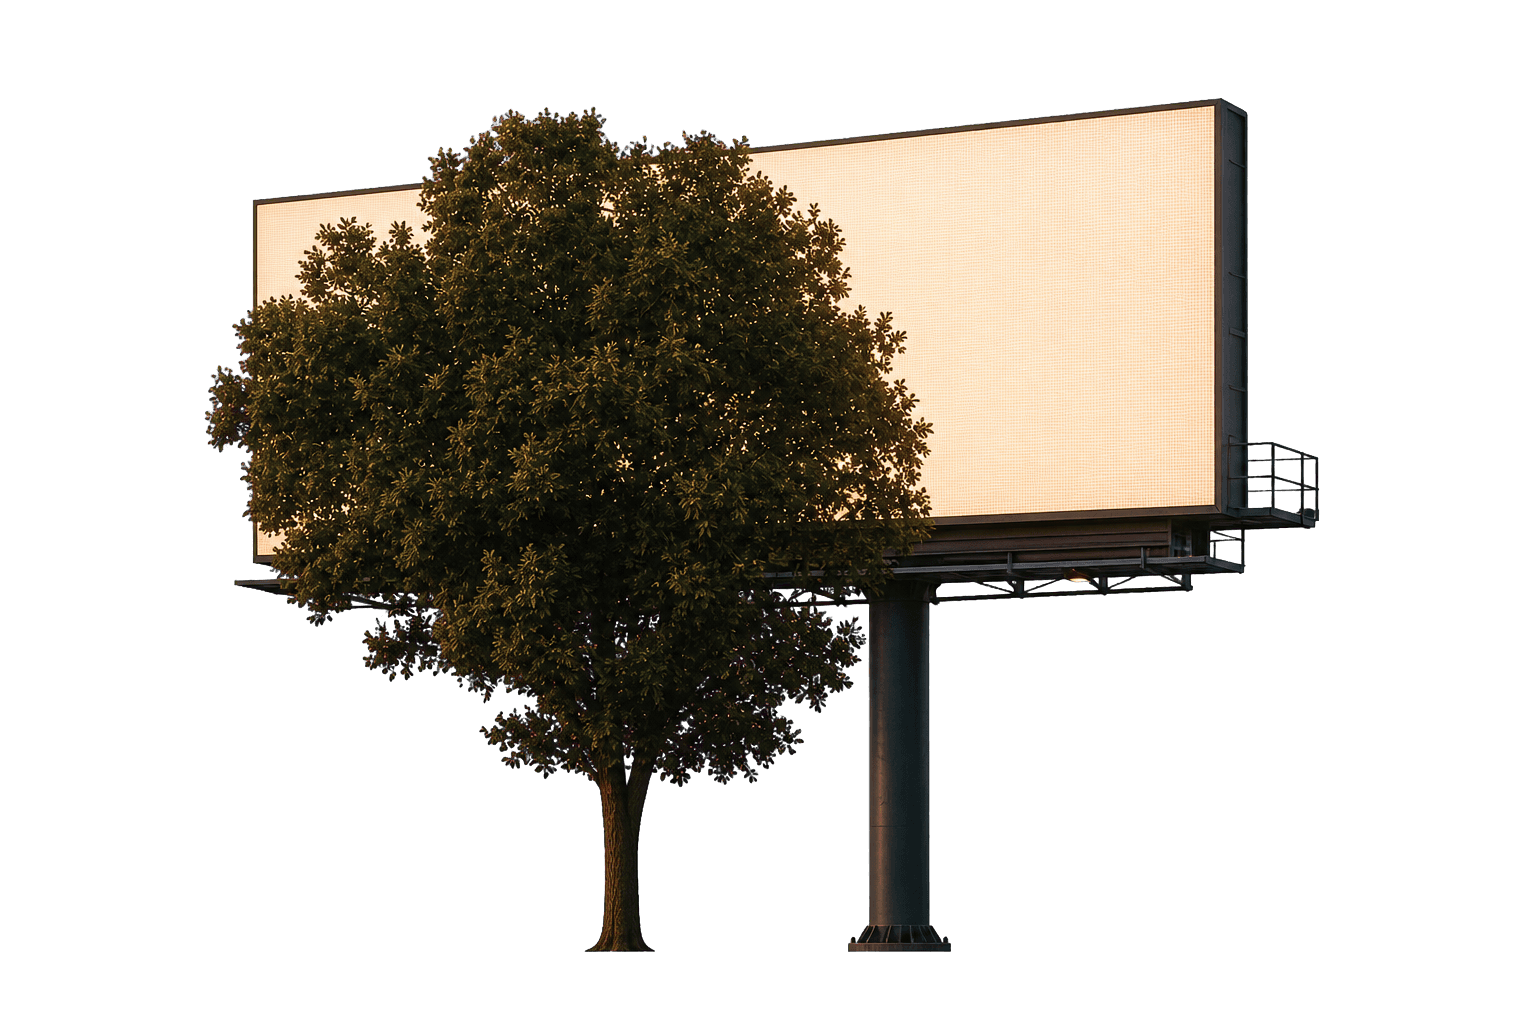
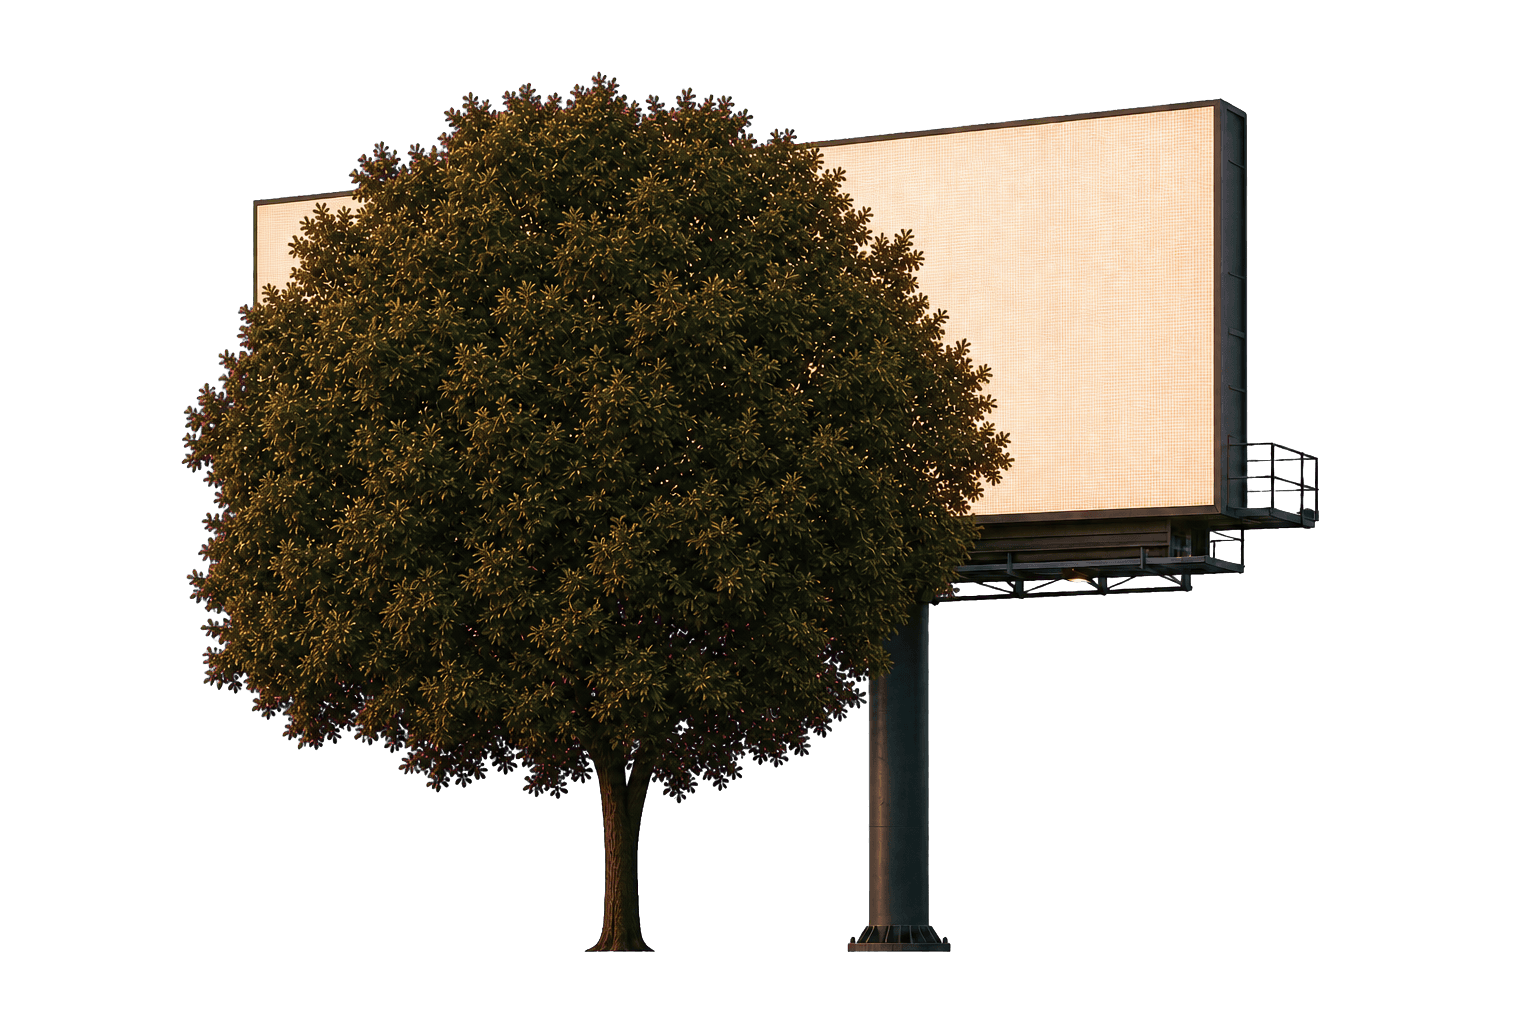
Panel faces, sightlines and tree crowns are reconstructed as geospatial models, with ground level removed so every crown near a sightline carries its true height. The model measures how much of each panel face survives the vegetation in front of it, from the worst viewpoint on the approach, and returns an obstruction score per face. The compute is deterministic: the same inputs always produce the same score. Judgement enters exactly once, at review.
Layer 03
AI species classification and obstruction forecasting
Each detected crown is classified to a species class, drawing on council tree records where they exist and AI classification from imagery where they stop. Species sets the growth curve: a plane tree and a eucalypt close a sightline at very different speeds. Growth applied across a zero-to-60-month window gives each panel its occlusion horizon, the month a tree is expected to cross the sign face.
Layer 04
Reporting
Results are published as a ranked, dated worklist rather than a raw score: which panels to keep, review or replace, which trees are driving the loss, and what it would take to clear them. Every figure carries the date of the capture behind it and links back to the evidence it was measured from.
Survey cadence
Surveyed twice a year, forecasted in between.
Panels are surveyed twice per year on imagery capture cycles. Between passes, the species growth model forecasts regrowth, so every score in the Index is either a fresh measurement or a dated forecast, never a stale reading.
Accuracy & review
Raw detection is wrong about one panel in ten. So a person reviews every result we publish.
Validated against manual review, Kestryl's raw detection disagrees with a human scorer on roughly one panel in ten, which is why no result is published without review. We publish the raw figure because the industry has no baseline at all: every score carries its survey date and traces back to the imagery it was measured from.
From score to action
Which trees can actually be pruned.
In our Australian coverage, every tree also carries its local planning-overlay status. Heritage-protected trees are flagged as plan-around; trees under vegetation or landscape controls are flagged as permit-required; unprotected trees can be pruned without a permit. That turns a visibility problem into a ranked, permit-aware worklist. Overlay coverage is currently Victoria only, expanding with the Index.
Full technical documentation ships with each quarterly report.