
Growth forecast60-mo model
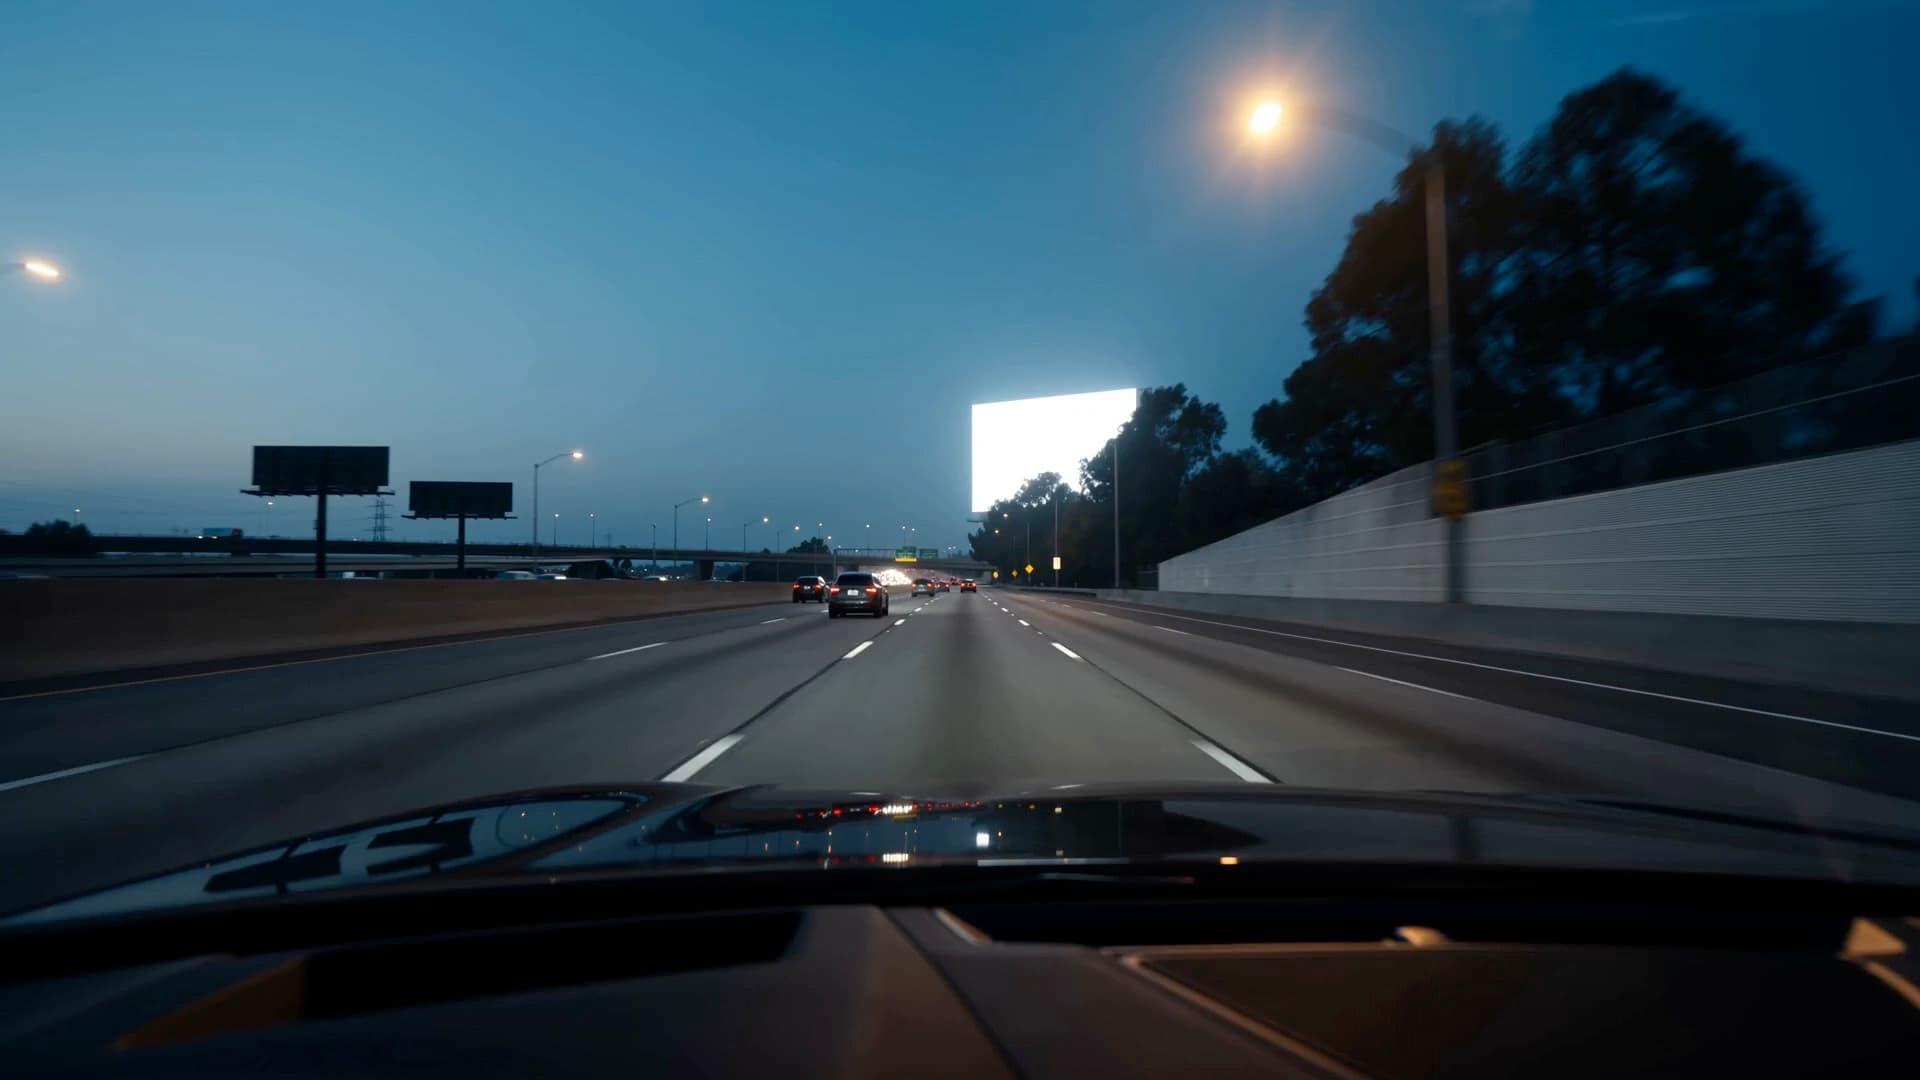
Physical visibility verification for OOH
Are you paying for panels nobody can see?
Kestryl watches every panel from the air and the road, and calls the moment a tree starts eating the view.
Every billboard gets a reading, and a date.
What a driver can see today, and the month growth takes it. Read from the road, forecast by species.
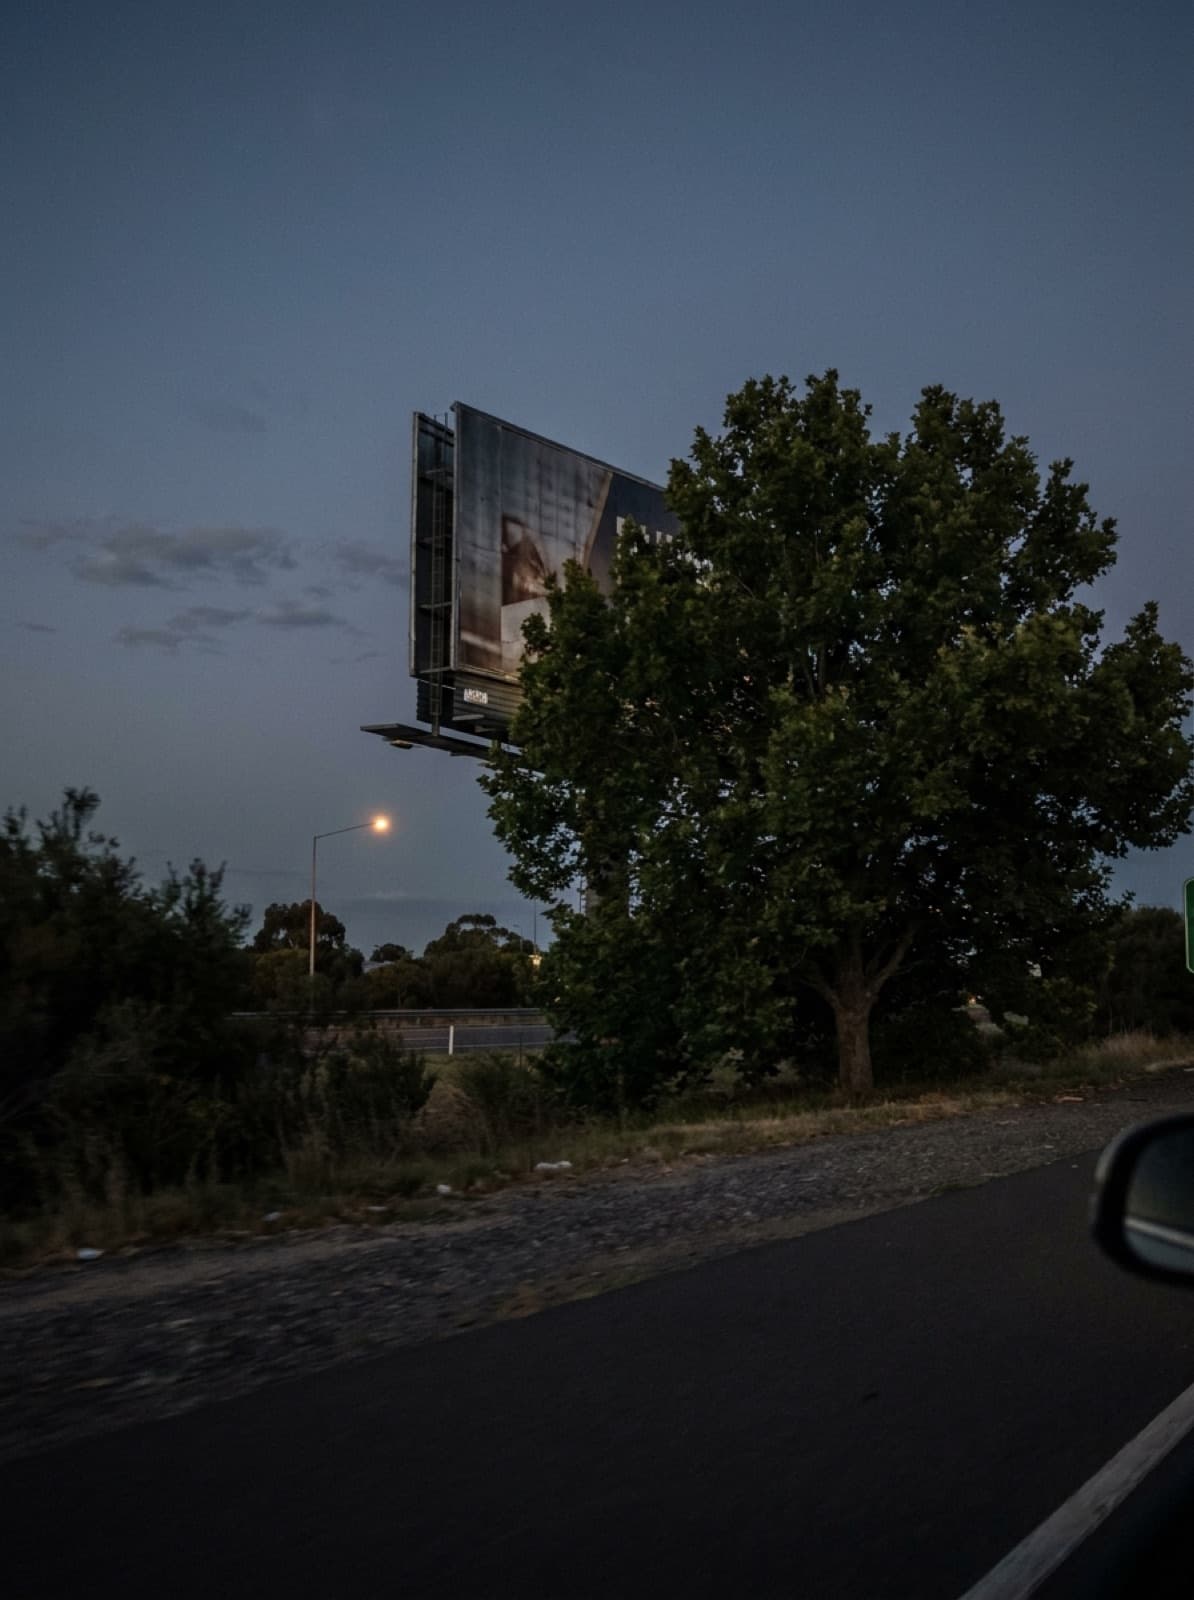
-37.8016, 144.9958 · 140 m out
Site check · GS-114714 May 2026
34%
Obstruction
- Site
- GS-1147 · Hoddle St NB188 Hoddle St, Abbotsford VIC
- Cause
- Platanus × acerifolia-37.80208, 144.99451 · 9.2 m · +1.1 m/yr
- Next
- Permit · ~6 wks
The Kestryl view
We watch from above.
Every corridor, flown and photographed. Aerial passes catch the canopy closing in; street-level capture confirms what a driver actually sees.
- Melbourne pilot live
- Aerial + street-level
- Species-level forecasts
Now multiply it by a country.
The measured Melbourne pilot, extrapolated across Australia's large-format inventory.
Large-format panels
~10,000
across Australia
Obstructed each year
600–700
modelled 6–8% annual rate
Trees near panel sightlines
220,000+
modelled from pilot survey density
Figures are drawn from Kestryl's survey findings, Kestryl's obstruction modelling and aggregated industry data. Methodology
The Kestryl Obstruction Index
Tracking physical obstruction across the world's outdoor media inventory.
6–8%
of panels become obstructed each year, Kestryl's modelled national estimate anchored to measured pilot data (600–700 of AU's ~10,000 large-format panels)
Read Bill Bored's Report →
Findings from the latest Kestryl Obstruction Index.
- large-format panels in Australia
- ~10,000
- modelled obstructed each year
- 600–700
- panels mapped or screened
- 2,000+
- panel faces deep-scored
- 48
Figures are drawn from Kestryl's survey findings, Kestryl's obstruction modelling and aggregated industry data. Methodology
The driver's eye
A sightline is never a still image.
Scroll through the same panel from surveyed evidence to forecast risk.
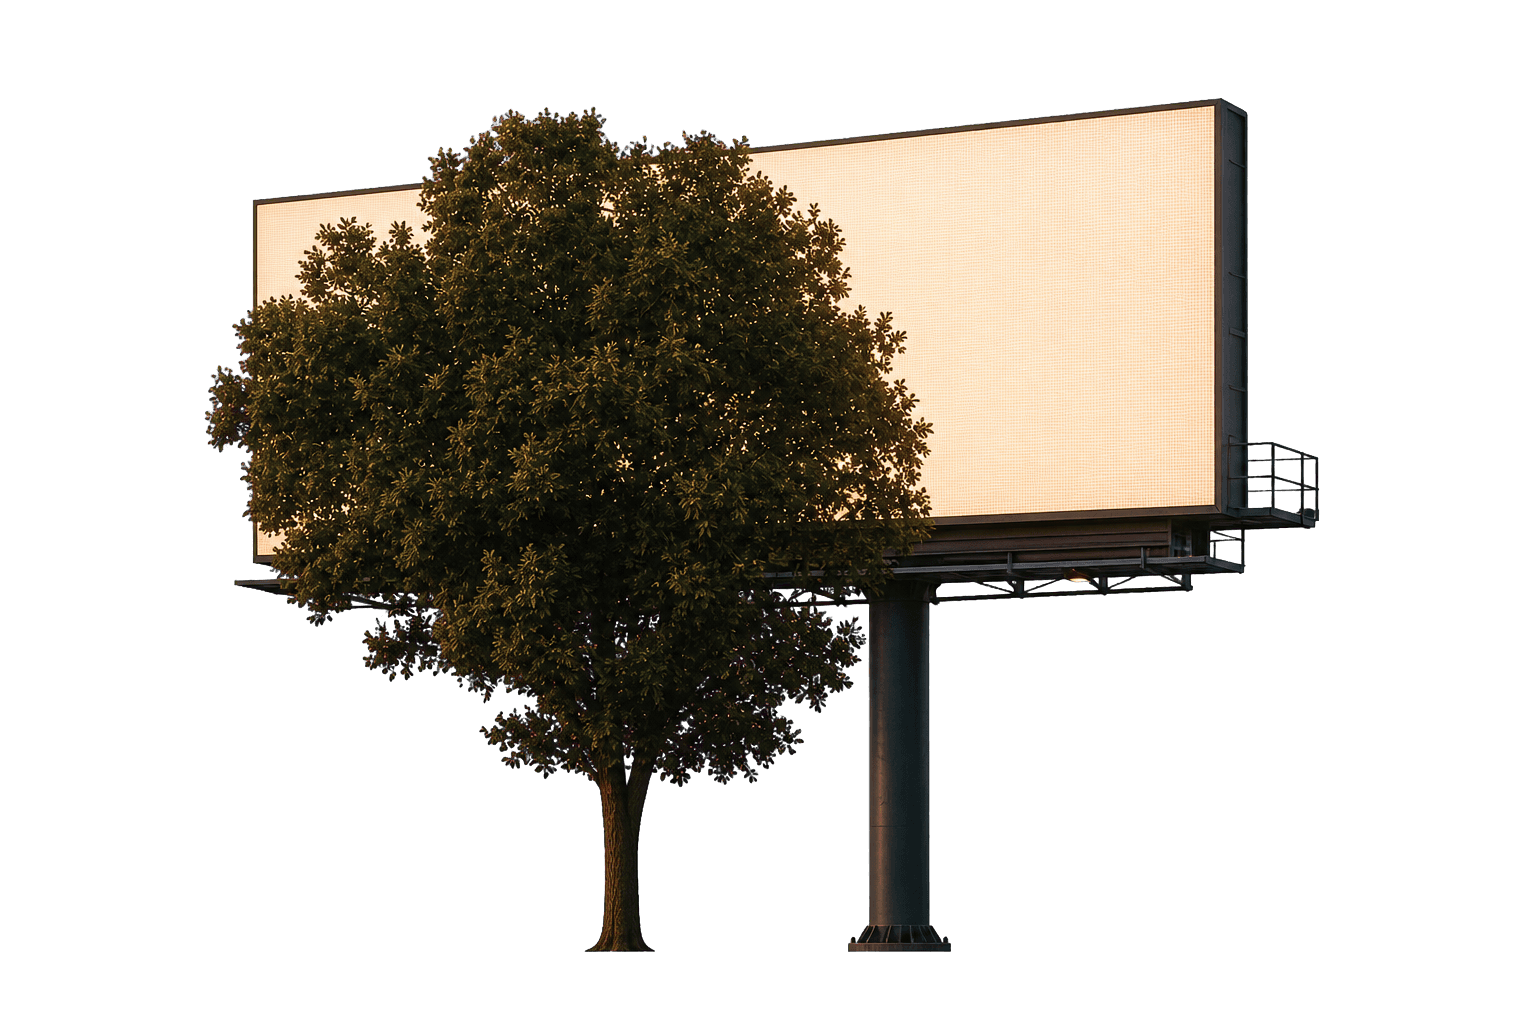
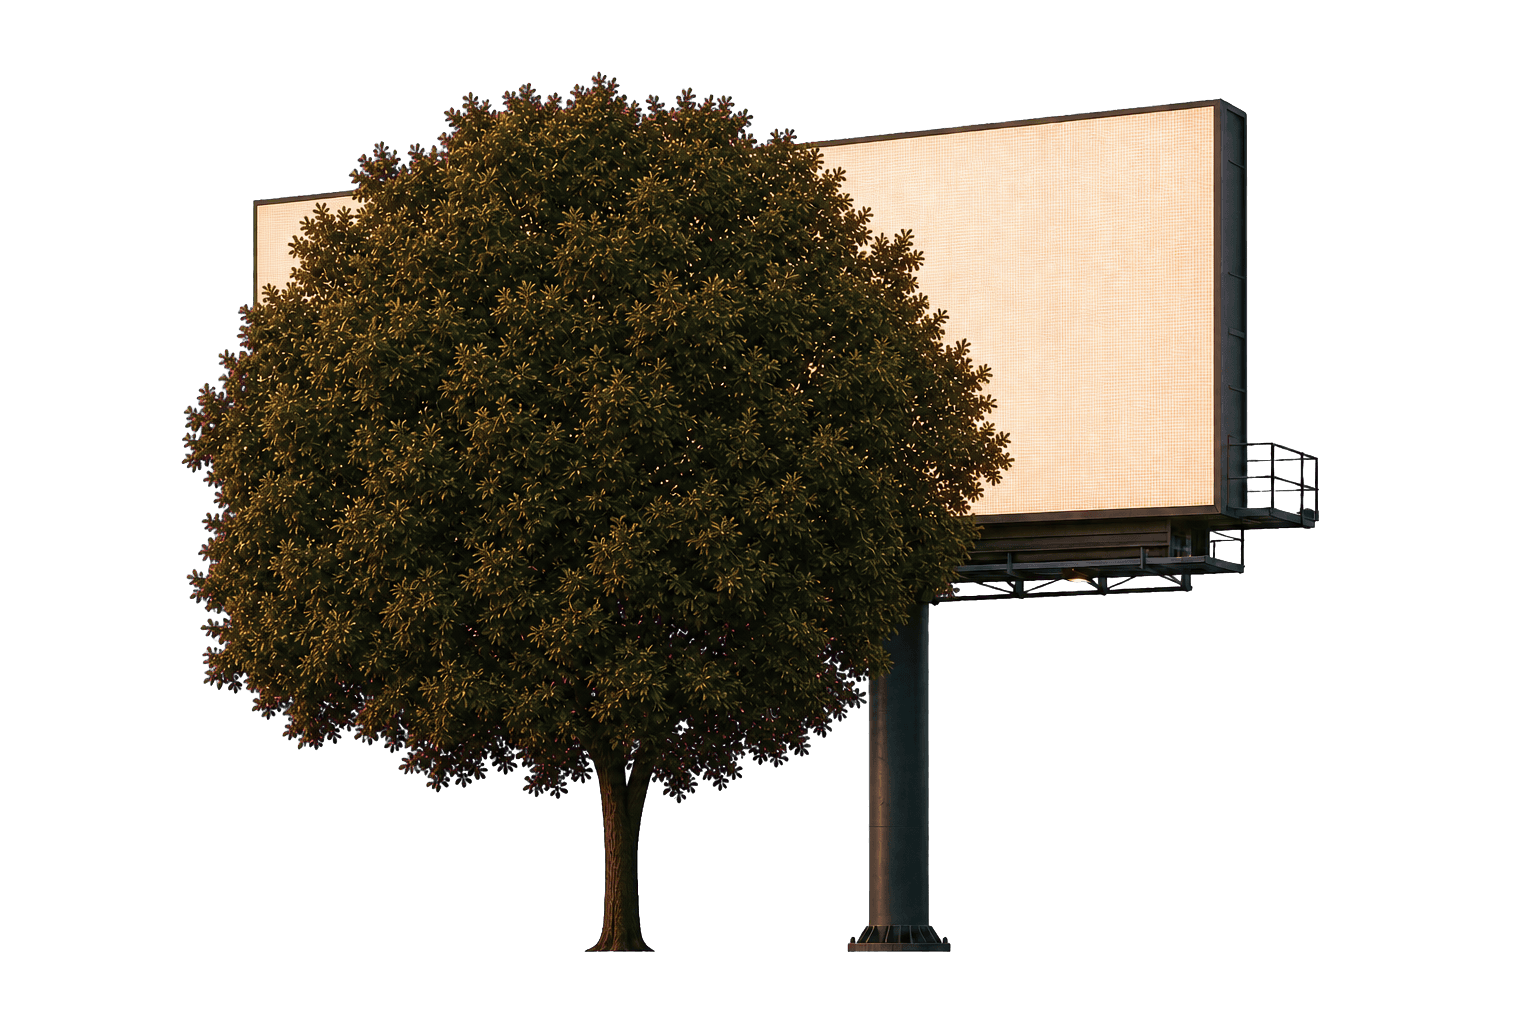
Current obstruction34%14 May 2026
Markets surveyed: 1
Panels mapped or screened: 2,000+
Global lost spend: Being quantified
Our mission
Quantify the advertising spend the industry loses to obstruction. Globally.
Nobody has ever put a real number on it. Kestryl is building that number one market at a time, panel by panel, from reviewed survey evidence. You have the power to contribute: every panel list shared adds faces to the record and sharpens the number.
Protect the panel. Verify the buy.
Start with a panel list.
Share a network or campaign list. Kestryl will assess available coverage and identify the appropriate visibility check.
KML, CSV or a plain list of addresses. Panel locations are enough to start.

Questions, answered plainly.
What is the Kestryl Obstruction Index?
A quarterly measure of physical obstruction across the world's outdoor media inventory: what gets between the panel and the audience, published by market. It is built from aerial imagery scored by Kestryl's occlusion models and reviewed before publication. More than 2,000 panels have been mapped or screened so far, starting in Melbourne, where 48 pilot panel faces carry full published scores; further markets are surveyed as the Index expands.
Where does the 6–8% obstruction rate come from?
From Kestryl's own modelling, anchored to measurement. The Melbourne pilot measured obstruction directly: 23 of 48 deep-scored panel faces showed 10% or more of the face blocked at the worst viewpoint. Combining that measured prevalence with species growth curves gives an annual onset rate, and applied across Australia's roughly 10,000 large-format panels the model puts it at 6 to 8%, some 600 to 700 panels a year, cross-checked against aggregated industry data. Every published Index figure links back to the methodology behind it.
How does Kestryl detect obstruction?
Aerial surveys give us a surface model, a terrain model and AI-detected vegetation for the same capture; subtracting terrain from surface gives the true height of every tree crown near a panel. Species come from council tree records joined to each detected crown, species sets the growth curve, and a ray-cast along the driver's approach measures how much of the face survives. The output is an obstruction score per panel face, plus a forecast of when the sightline will close. Every published result is reviewed by a person first.
Do you need our booking or revenue data?
No. Kestryl works entirely from imagery and public geospatial data. Panel locations are enough; we never ask for booking systems, rate cards or campaign data.
Who is Kestryl for?
Media owners use it to protect inventory value and schedule maintenance before revenue leaks. Advertisers and agencies use it to verify the sites they book are physically visible. We exist to help owners spot the obstruction, and help advertisers avoid it.
Does Kestryl replace proof-of-play or delivery verification?
No. Delivery verification confirms whether advertising ran as planned. Kestryl assesses a different part of the campaign: the physical visibility of the panel itself. The two are complementary, and strong out-of-home assurance can include both.
How current is the data?
Panels are surveyed twice per year on aerial capture cycles, and between passes a species growth model forecasts regrowth, so every score is either a fresh measurement or a dated forecast. A score always carries the date of the survey it was measured from, so you know exactly how current the number is.